Adaptive Scheduler On Demand Demo v1
Explore some of our favorite features right now with an on-demand video demo. Get instant access!

Get 3 days for the price of 2 thru 7/15
Nov. 3-5

Upcoming: PSUG Vegas | July 13-17

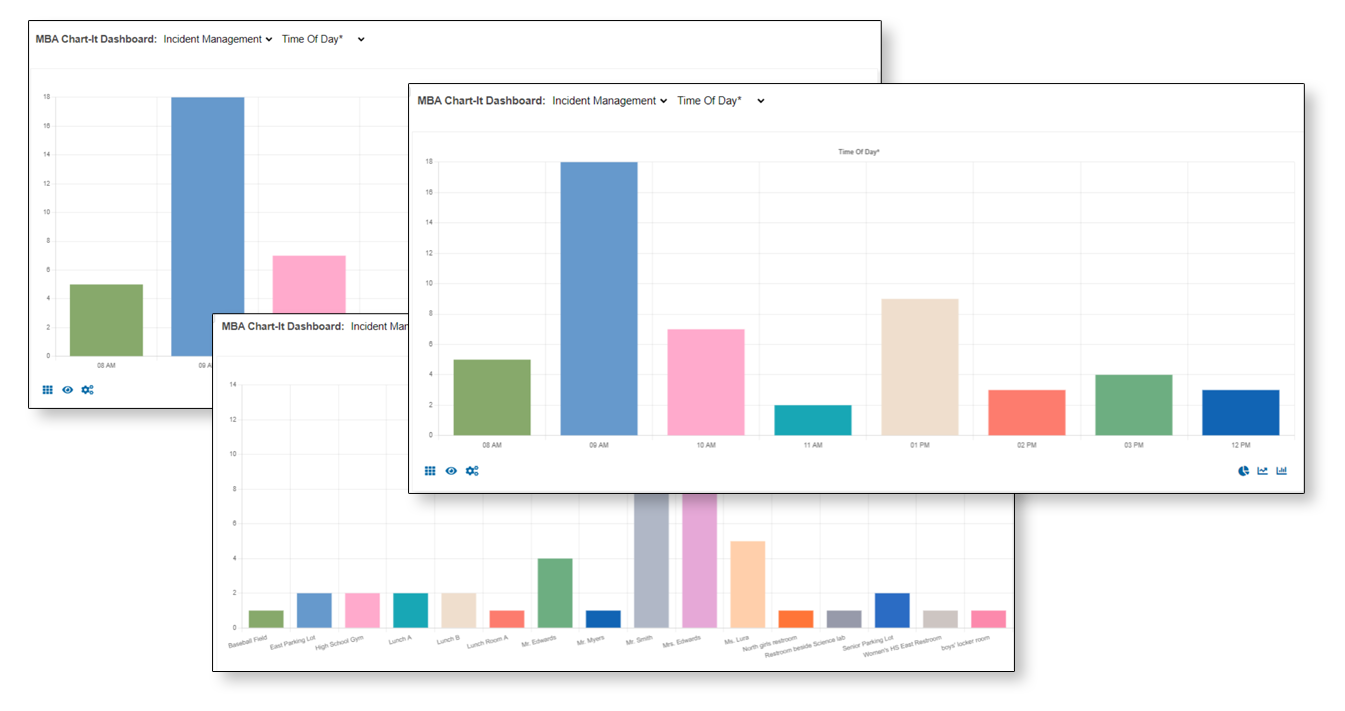
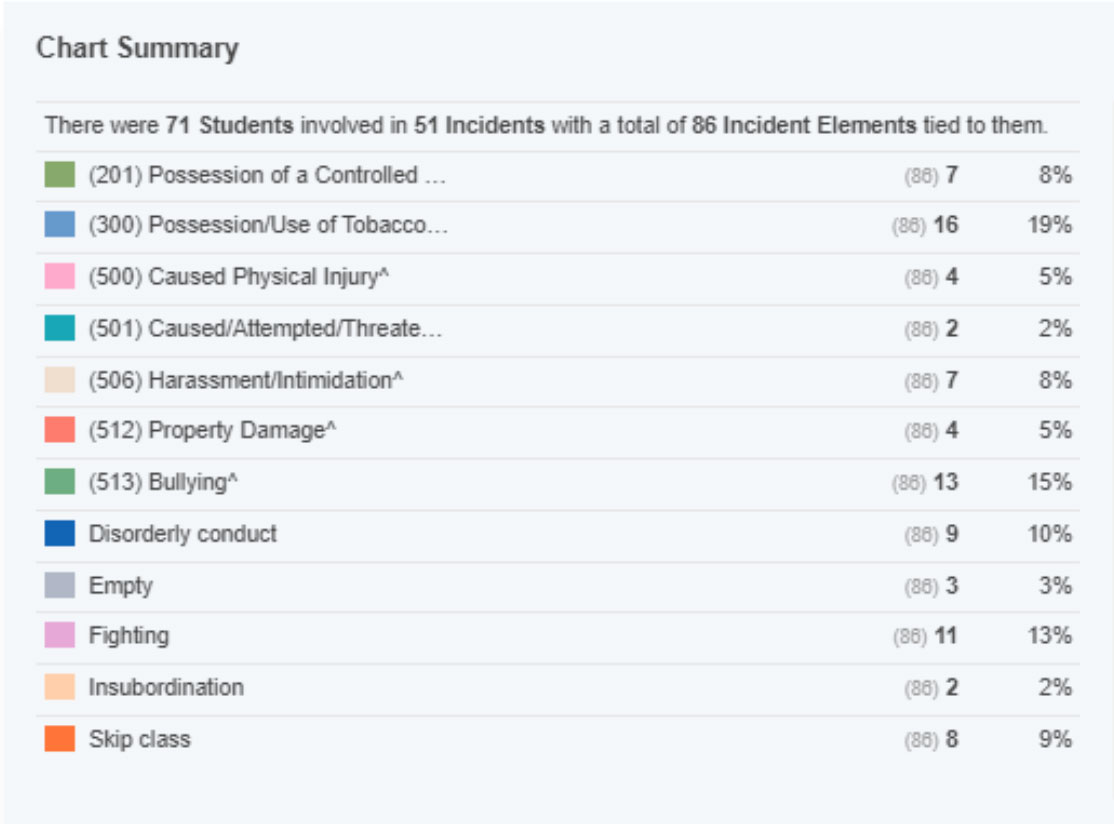
Efficiency begins at the point of entry, and MBA Incident Creator makes documentation quick and straightforward. Teachers can log incidents using a custom form or a PowerSchool Incident Template, while administrators review referrals and decide what moves forward. MBA Incident Creator delivers faster processes, clearer communications, and less time spent on paperwork.
Explore some of our favorite features right now with an on-demand video demo. Get instant access!