


Chart-It
Plugin for PowerSchool
Develop a deeper understanding and gain valuable insights from your incident management and student data. Discover new perspectives, identify trends, and foster a culture of continuous improvement through actionable insights.
Understand & Take Action
Gain invaluable insights into incident occurrences, reporting locations, behavioral patterns, and key details with Chart-It Plugin from MBA. Uncover a comprehensive understanding of incidents within your school, including frequency, timing, individuals involved, and specific behaviors. All visualized with customizable charts and filters, enabling proactive interventions and a safer school environment.
Chart-It On Demand Demo
Explore some of our favorite features right now with an on-demand video demo. Get instant access!
EASY TO USE INTERFACE
CREATE YOUR OWN CHARTS WITH FILTERS
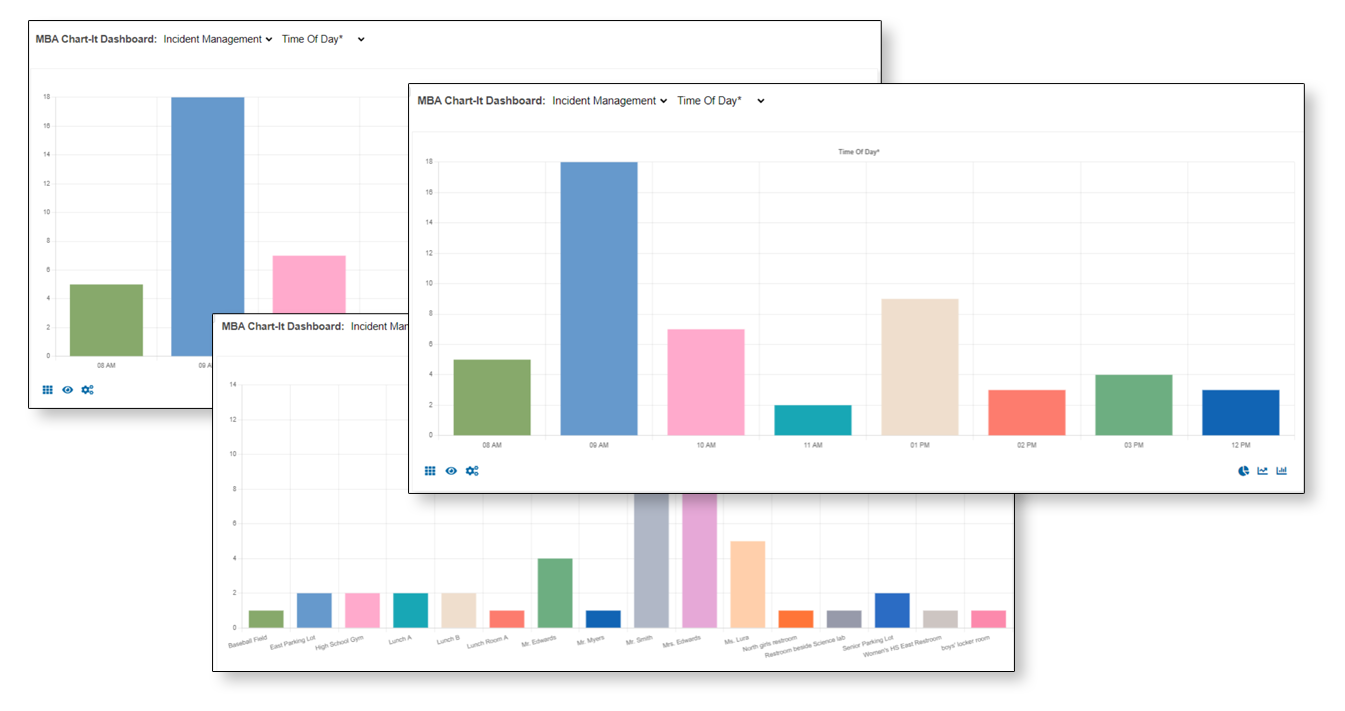
ADVANCED LOGIC FILTERS CAN CHART INCIDENTS ACCORDING TO DAYS OR MONTHS
SHARE WITH OTHER POWERSCHOOL ADMIN USERS SUCH AS THE PRINCIPAL
VISUAL LOOK INTO INCIDENT MANAGEMENT DATA
IDENTIFY STUDENT TRENDS
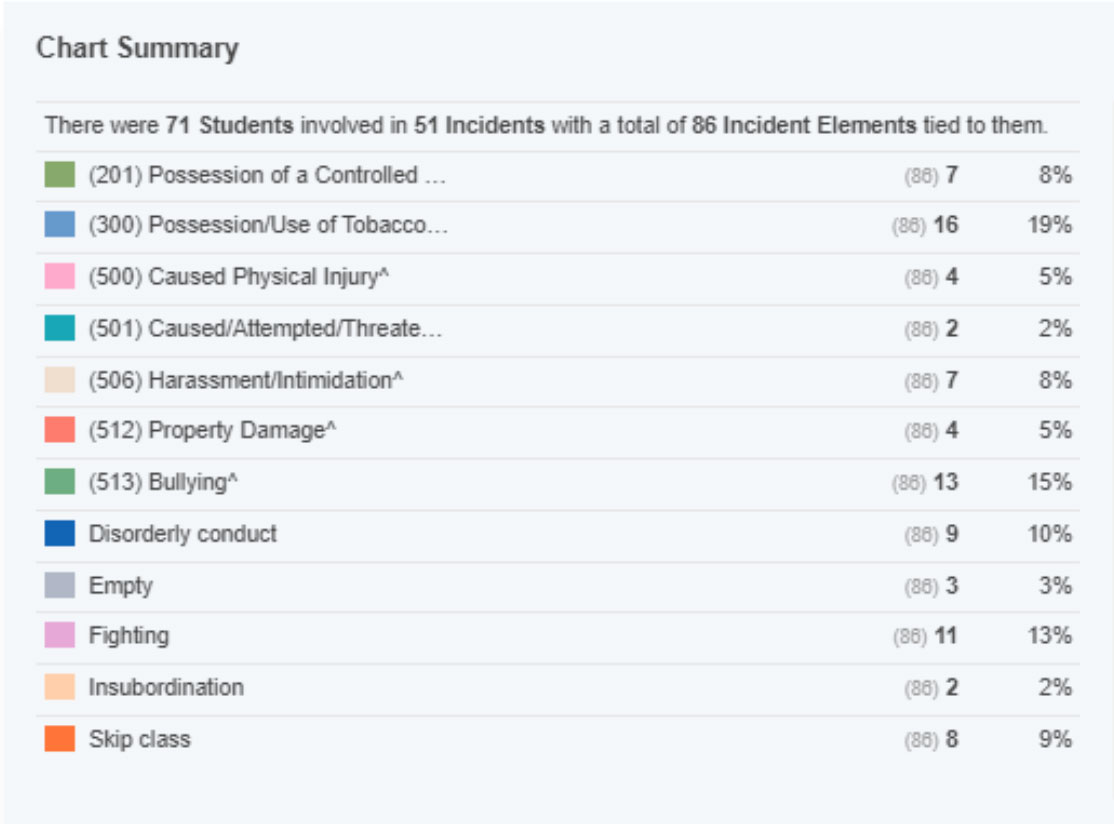
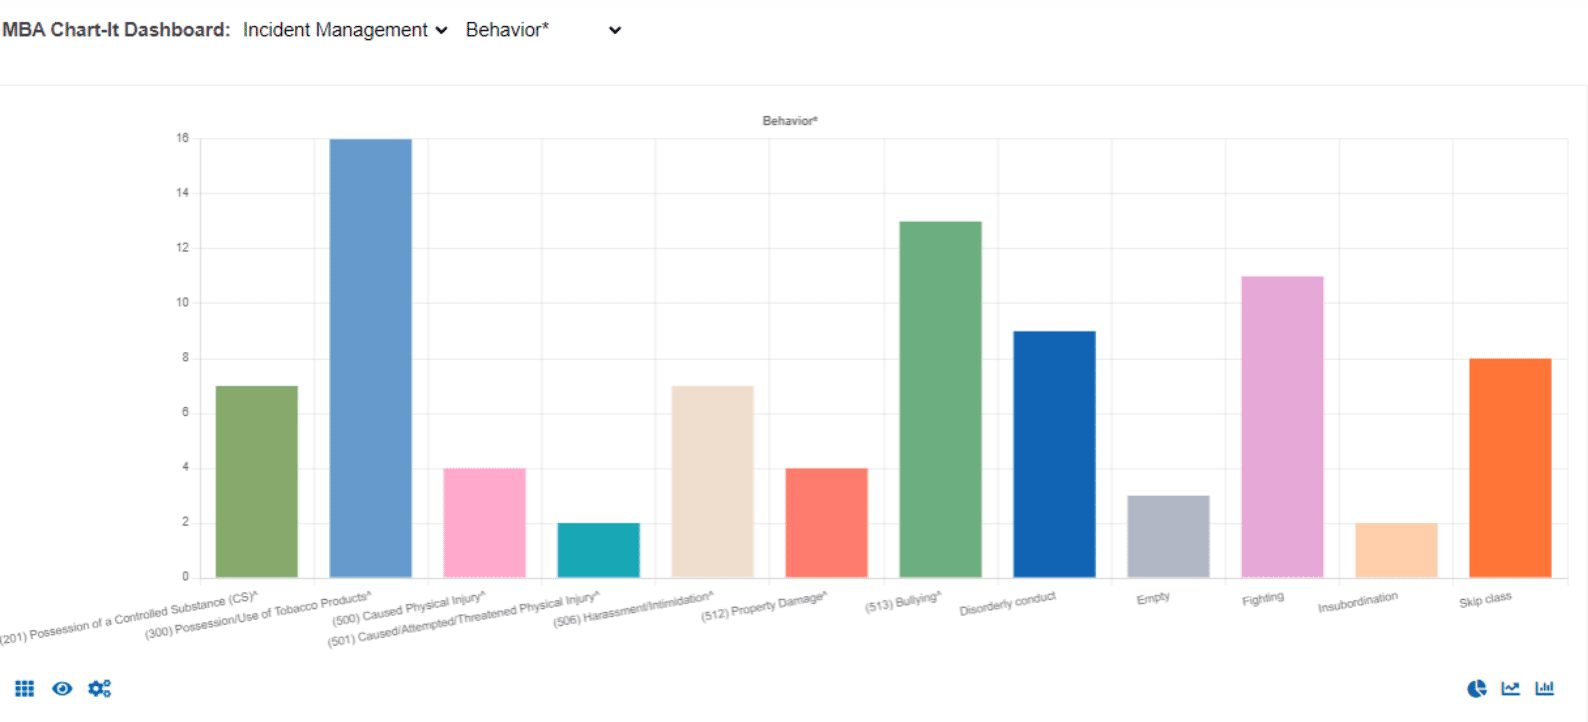
CHART SUMMARY OF BEHAVIORS TRENDS
FILTERS, ADVANCED LOGIC AND CREATE CUSTOM CHARTS
MBA Chart-It Tips and Tricks
Here are some tips and tricks for using the Chart-It Dashboard in MBA Chart-It.
Have you ever needed to use an existing chart in a presentation or report without including the dataset? You can easily copy and save images directly from the Chart-It Dashboard.
From the dashboard, right-click on the chart you want to use and select “Save Image As” to save it to your computer. Once saved, you can insert the image into a document or presentation.
To copy the image, right-click on it and select “Copy Image.” Then, proceed to your document or presentation, right-click, and paste the image.
These simple steps make it easy to incorporate charts into your reports or presentations without the hassle of dealing with the underlying data.